This article will show you how to retrieve data from podcasts.
We have implemented tracking on podcasts across platforms. This means that you can see the total number of podcast events for iOS and Android in the same place in Google Analytics.
A podcast event is sent every time a user does one of the following actions:
- Pause the podcast
- Skips to the next track
- When the podcast is finished
- If the user force closes the app or otherwise stops the podcast
The timer is independent from the timeline, and it is not affected by forwarding og rewinding. The timer starts when the podcast is started, and the recorded time will be sent together with an event. The timer is reset every time an event is sent.
Please follow the guide below, if you want to find and work with podcast data.
________________________________________________________________________
1. Make sure you are logged in to your Google Analytics account.
2. Choose your ePaper, and navigate to your desired view
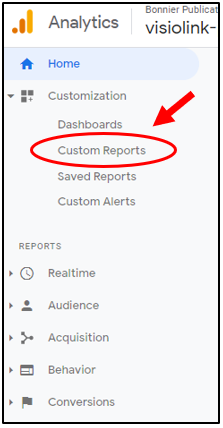
3. Go to 'Custom Reports' located under the customization tab in the top left side of GA
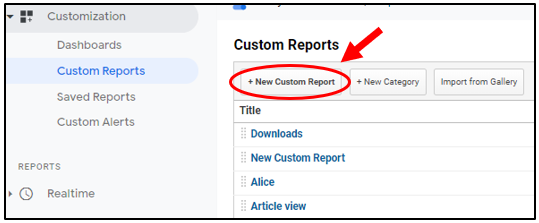
4. Click 'New Custom Report'
5. Fill out the forms exactly like the image below and click 'save'
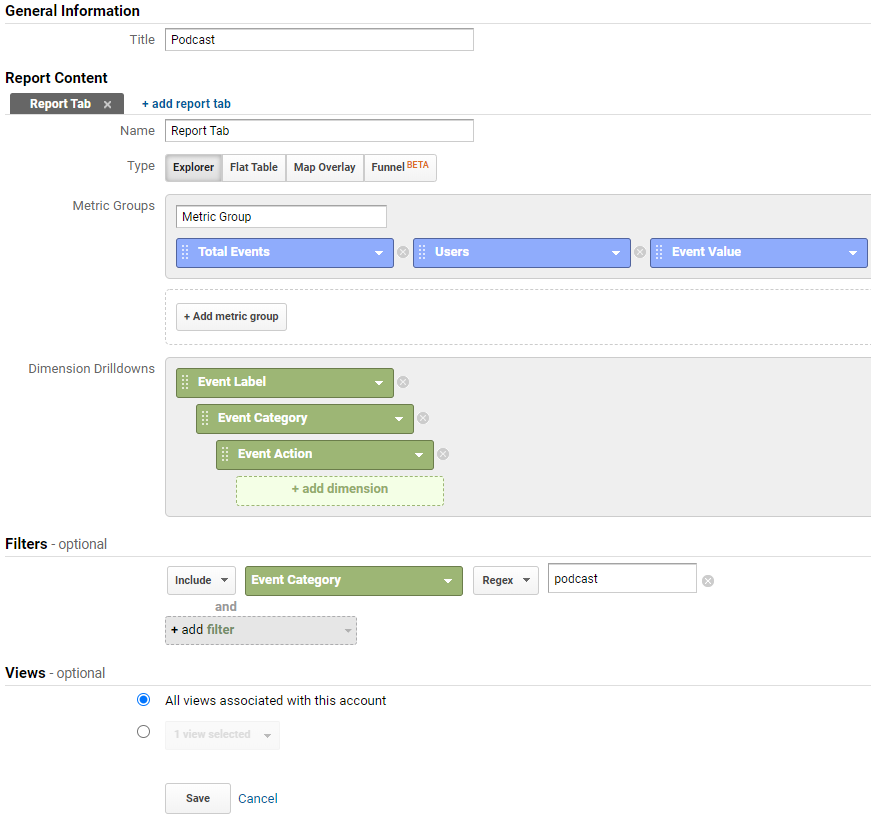
*Remember to set the filter to ‘Regex’ to make sure Google can find all the event data.
6. Now you can see the number of podcast events and EventValue (# of seconds listened)
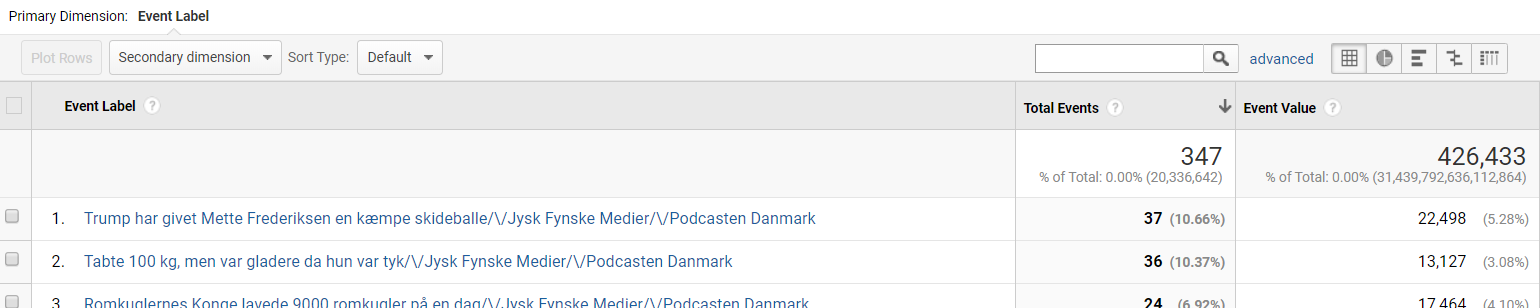
The content being shown is different depending on your choice in "Dimension Drilldowns".
The main options are:
Event Category sends the customer name and the event type.
Example: ’borsen - Podcast’
Event Label shows the podcast title, the podcast author and the podcast channel name.
Example: ’Har Dansk Folkeparti nået bunden?/\/Jysk Fynske Medier/\/Podcasten Danmark’
Event Action shows how the podcast was reached and length (sec).
Example: ’Front page/\/Sec. - 2002’.
It is also possible to look at other dimensions such as "Client" or "App Version",
please see Custom Dimensions for more information regarding this.
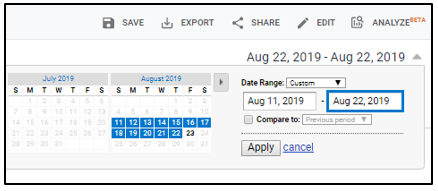
7. For specific date range, go to the top right corner and choose the desired date range.
_______________________________________________________________________
When the custom report is made, it is saved to your customization tab and you can use the same one to get data for a new date range, you don't need to make a new report the next time you want data.
If you would like more information or guidance,
feel free to contact our Business Intelligence department at bi@visiolink.com.
Comments